Commodities Update – 16th Jan 2015
January 16, 2015Friday 16th January 2015 – 14.10
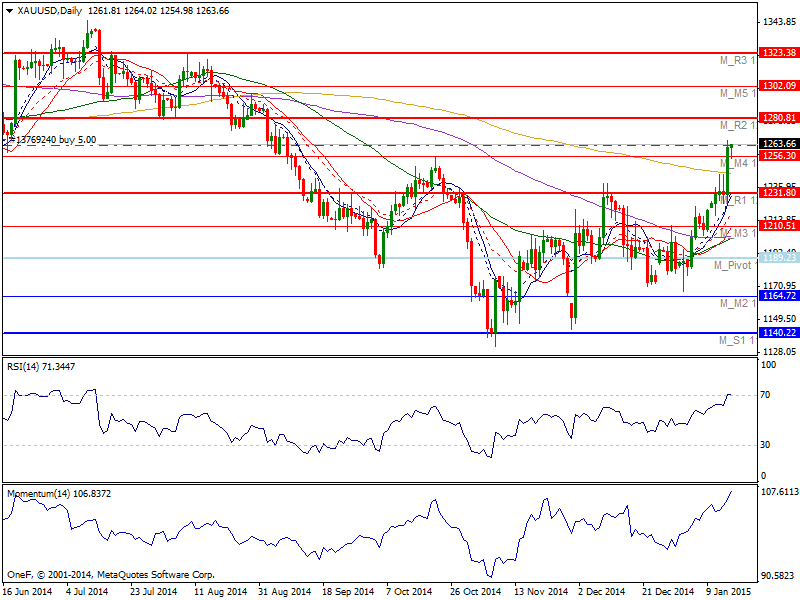
Gold: XAU/USD edged higher yesterday following a statement from the SNB removing its EUR/CHF peg of €1.20 resulting in a 30% fall in the pair, triggering a market ‘tsunami’ which resulted in the safe haven safety of gold. Currently hovering around the $1263 mark having broken a midway topside resistance at $1260 with the next clear target at $1280. The chart looks very positive although with Thursday’s higher coinciding with an overbought reading of 80 on its RSI it’s likely to see a pullback to a previous level of support at $1231 which will probably be needed in order to build up enough momentum to continue going higher.
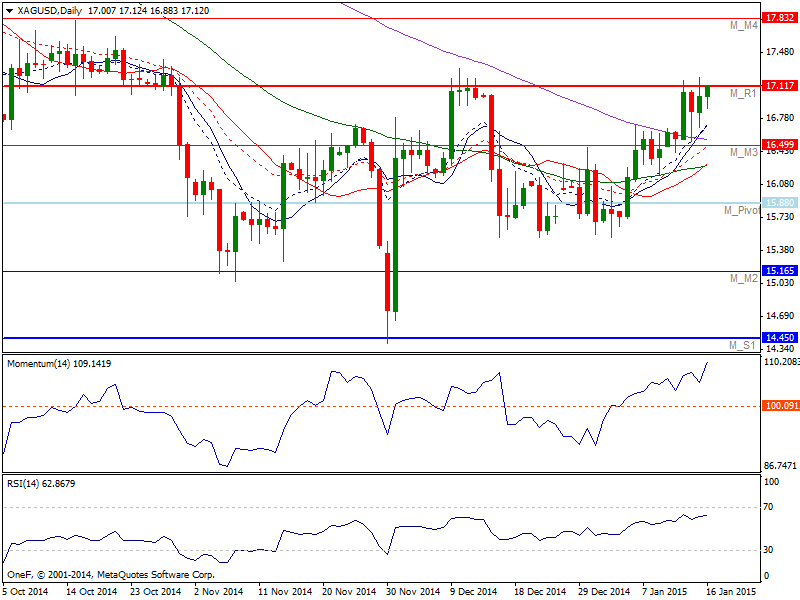
Silver: Currently trading around its key level of support, at $16.93 level which if held could see a retesting of Thursday’s topside resistance at $17.13. There is a significant amount of resistance at the $17.50 level so we need to clear that region on a daily close in order to start buying. However should downside support fail to hold then the next downside target is seen at $16.79 level. Any pullback at this point in time should more than likely end up being a buying opportunity going forward. Nonetheless, keep in mind that although gold has broken out, the silver market has basically sat still which is an anomaly, as the two markets incline to push in the same direction.
WTI: Crude initially pushed higher during the course of the session on Thursday, rising all the way up towards the $52 level. This of course was a very bullish sign, but ultimately we could not keep the gains and ended up turning around to form a massive shooting star. The $50 level has obviously shown itself to be resistive and as a result we feel that the market will continue to go lower. Prices are currently trading at $46.97 and we think that the market will test the $44 level again for support and could possibly break down below there. Therefore, this market cannot be bought at this point as the longer term charts will have to show us the signal to start buying and until then we have no interest in going long we believe that the oil markets will remain to be soft.

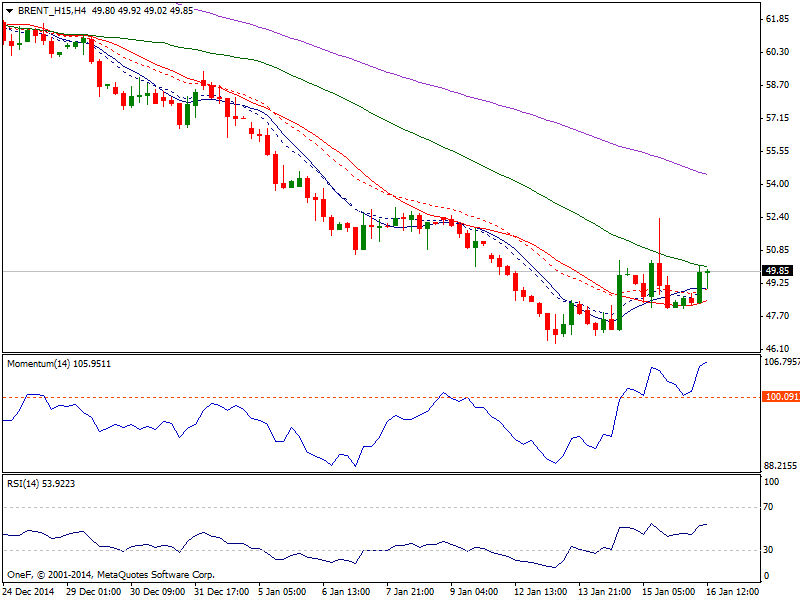
BRENT: During the fallout of the SNB’s decision to remove its currency peg to the euro at €1.20, Brent spiked to highs of $52.44 before settling at $48.48. As with WTI we ended up forming a shooting star in this market too, so it seems like the oil markets are all lining up to continue going lower. However, such a move has seen previous resistance at $48.19 turn into support with Brent prices currently trading at $49.61. The $45 level below will of course be supportive, but ultimately we believe that level will get broken down at this rate. Selling rallies will probably be the way to go going forward and perhaps using short-term charts might even make that particular trade easier. Just as in the WTI market, we will wait to see a longer term buy signal to consider changing direction.