Commodities Update – 8th Jan 2015
January 8, 2015Wednesday 8th January 2015 – 13.45
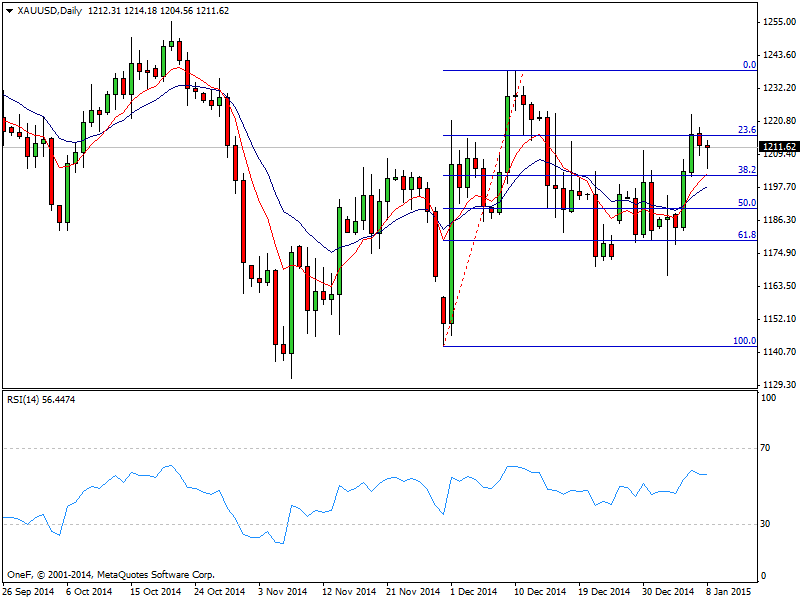
Gold: Traders maintain to unwind gold positions currently trading at $1208.2 having encountered some downside resistance at $1204.5. This level must be broken in turn to validate the continuing downward movement. The downside target now presents itself at the 38.2 % Fib Level of $1201. If we break down below the $1200 level, we could go as low as $1180 coinciding with the 61.8 % Fib level in the very short-term. On the other hand a break above the $1215, 23.6 % Fib level is reason enough to start buying short term moves to the $1238 level. That level should be rather resistive though, so this is definitely a short-term opportunity. In any case expect a lot of unpredictability surrounding the gold markets in the next couple of sessions.
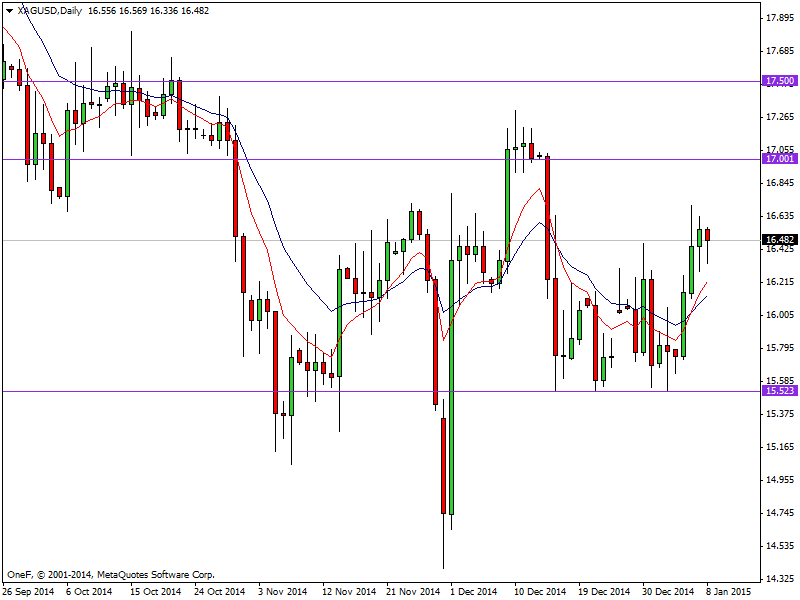
Silver: XAG/USD continues to push higher posting a lower high at $16.36. The previous low of $16.30 will need to be held to confirm the bullish trend which if attained could see a retesting of upside targets between $16.45-$16.52. With this, we believe that there are short-term buying opportunities on a break of the highs from the session, but you will have to be fairly swift as there will be a lot of volatility between here and the $17.50 handle.
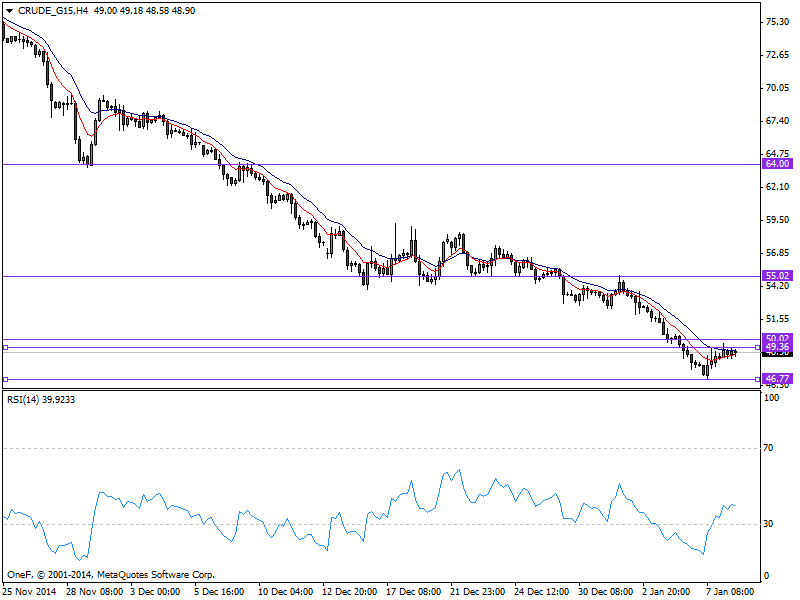
WTI: WTI pushed back to previous downside support at $49.39 which has subsequently seen the short-term bullish trend fail and reverse to its current level of $48.95. Should topside support continue to hold, a retesting of previous downside target at $46.72 is most likely, supported by a RSI reading of 46. A lot will compose on what happens with US dollar in the next few weeks, which looks a bit overextended too. With that, we could get a little bit of a relief rally, so therefore we are looking to buy this market above the $50 level.
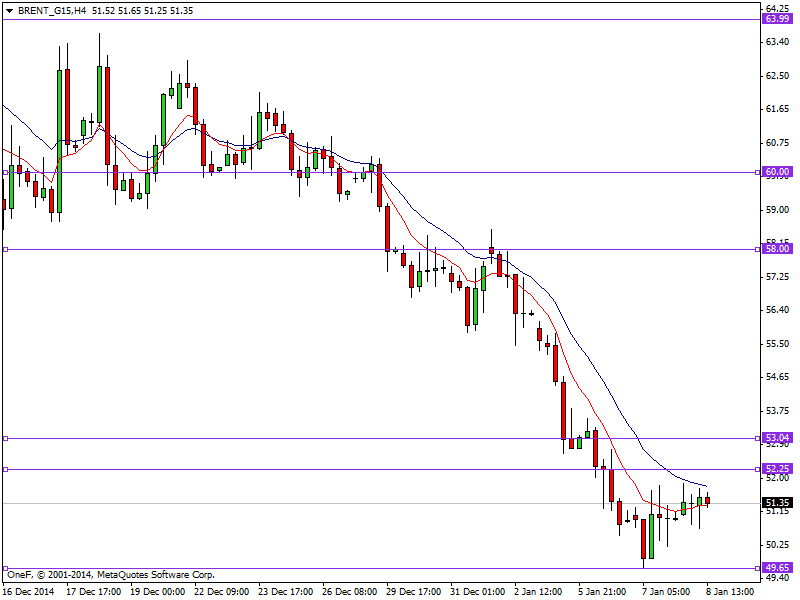
Brent: Brent prices bounced off multi-year lows of $49.66 on Wednesday, pushing past the $50 psychological level, currently trading at $51.34. Topside support is currently trading at $52.26 which if held is likely to result in a retesting of further downside with targets of $49.16 likely to be seen. On the other hand a move above the $53 level sends this market looking for $58, and then possibly $60 after that.