Commodities Update – 7th Jan 2015
January 7, 2015Tuesday 7th January 2015 – 11.58am
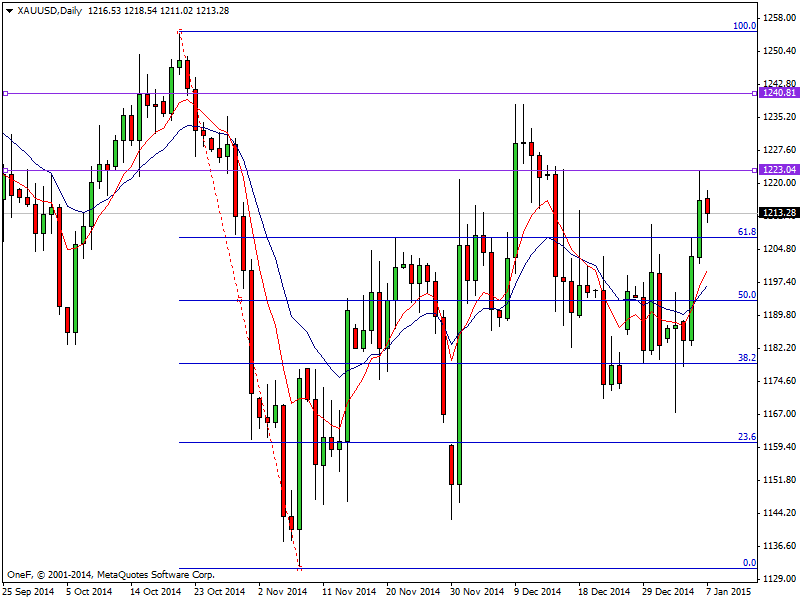
Gold: XAU/USD reached the $1223.19 level on Tuesday the highest since 16th December on haven demand risk off trading after “Grexit” became a distinct possibility and contagion began to spread to the other distressed Euro-Zone economies with Germany already threatening to throw Greece out of the union. This morning tensions have eased a bit with XAU/USD trading at $1214.00. From a technical perspective it appears that the market could go a little bit higher, but there is significant resistance at the $1240 handle which would be a nice selling possibility. On the other hand if we do break above this $1240 level, at that point time we start buying gold again as it should then break much higher targeting the 100% fib level of $1255 (see chart below). In the meantime though, we are cautious of the fact that it is the FOMC minutes today, so that of course will greatly influence the dollar which will have a knock on effect on gold markets.
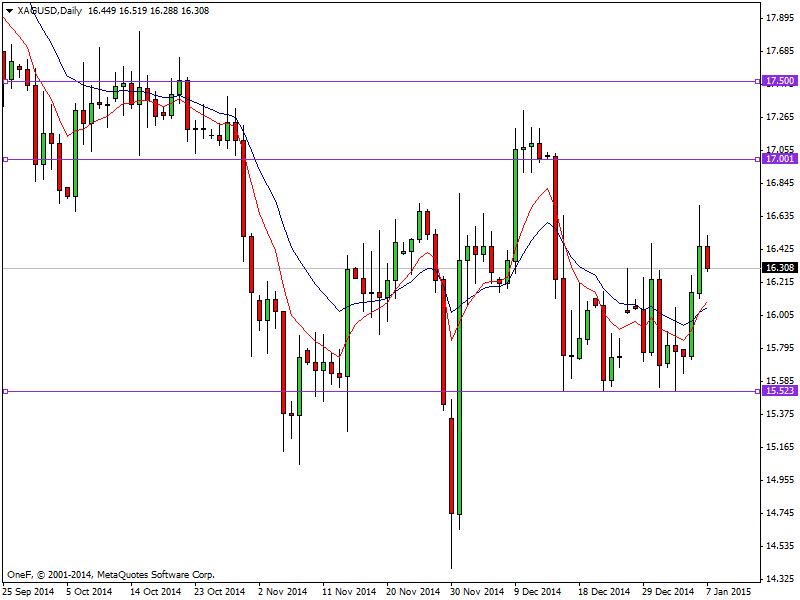
Silver: XAG/USD traded on an optimistic note on Tuesday touching well above the $16.50 handle, with this morning tensions easing a bit with XAG/USD down to $16.473. There is a considerable amount of resistance at the $17.00 level so we would be a bit cautious to start going long at this point. We believe that a resistant candle in this general area would be the way to go as we would start selling and aiming for $15.50 again. We believe that resistance could continue all the way to the $17.50 handle so currently we are not ready to start buying.
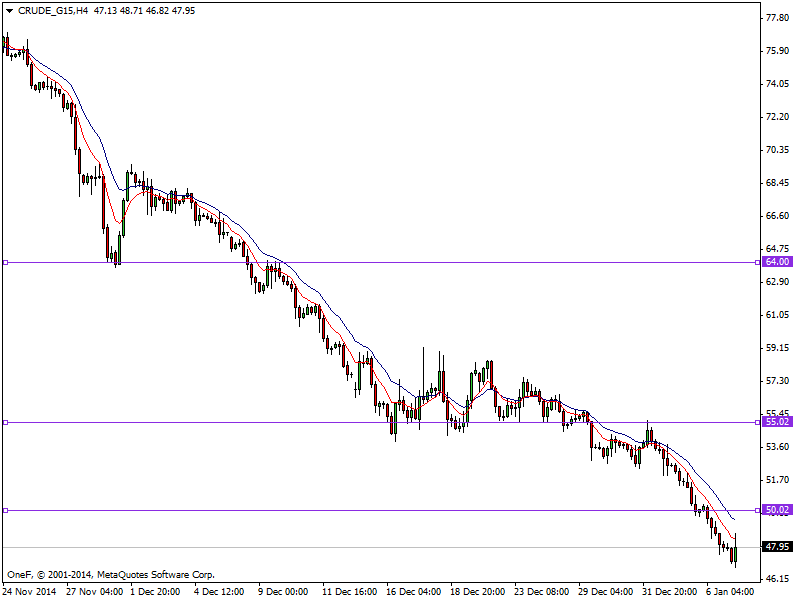
WTI: WTI fell hard during the session on Tuesday breaking down below the psychological $50 level sinking to fresh 5-1/2- year lows as doubts over a global supply glut deepened. The US dollar continues to gain in value and that of course will work against the value of oil continuing to be one that generally falls going forward. It now appears that we will have to start aiming for the $45 level. The $55 level above will now be resistive, so we believe that rallies all the way up to that level will offer selling opportunities more than likely.
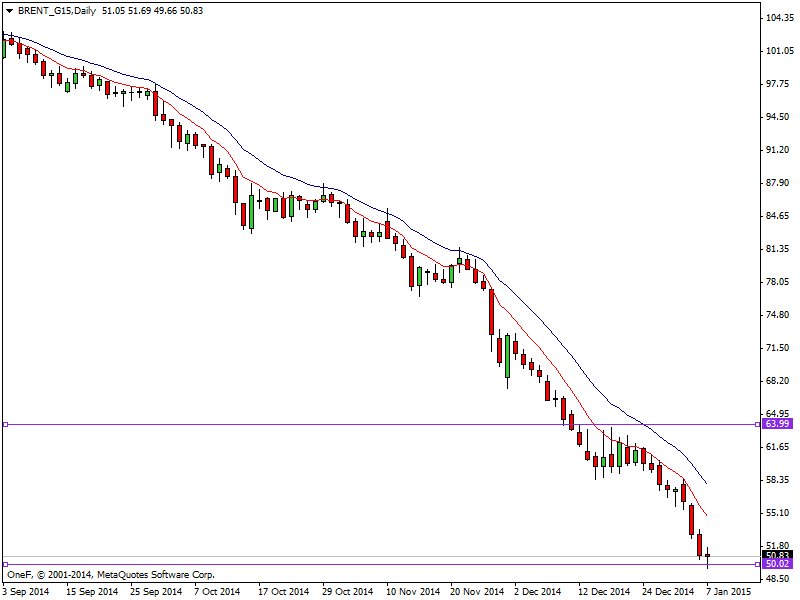
Brent: Brent fell by 3 percent to below $52 a barrel testing the $50 level as cuts to monthly oil selling prices for European buyers by top OPEC producer Saudi Arabia heightened worries about oversupply. The $50 level could offer a bit of support and cause a little bit of a bounce, but honestly the way that the oil markets are falling apart, we believe that we will more than likely go below there as well. The $50 resistance level and with the downtrend being strong we will look to short-term charts to start selling as most of the moves will probably be very small. We believe that this market cannot be bought at least until we break well above the $64 level, something that doesn’t look very likely to happen anytime soon.