Daily Market Update – 17/02/15
February 17, 2015Tuesday 17th February 2015 – 09:30
In Europe, the Greeks continue to stand their ground and refuse to allow the Eurogroup to dictate terms to them. In a much shorter meeting than last week, Greece refused the deal that was put before them and with the negotiations clearly tense the prospects of a solution are dwindling. Even though expectations were low with respect to yesterday’s Eurogroup meeting of EU finance ministers, with no realistic prospect of a positive outcome, as both sides try and push the limits of what they are prepared to accept, or not accept, I think most people still thought that the talks would last well into the evening, as is the norm with these events. This has all taken a negative impact on market sentiment. With Wall Street closed for Presidents Day the Asian markets have been mixed overnight. Another round of disappointing Chinese housing data has again resulted in a lift of the Shanghai index. It seems as though the “bad news is good” theme continues with Chinese data with the prospect of further easing of monetary policy constantly being aired. The Nikkei 225 was 0.1% lower. European equity markets are weaker in early trading.
Traders will be on the lookout for UK CPI this morning which could have an impact on sterling. With the Bank of England recently suggesting that the UK could slip into deflation in the coming months, the CPI number is expected to continue to slide today to +0.3% (from +0.5% last month). The reading last month was well below expectations and if this happens again it could be a drag on sterling. The German ZEW Economic Sentiment will be impacting on the euro at 1000GMT. After having fallen throughout 2014, for the past 3 months the ZEW has not only risen but also beaten expectations. The forecast is for 55.4 (up from 48.4 last month). The only other entry on the calendar of any note is that at 1700GMT the SNB’s Jordan is set to speak ad this could impact on the Swissy.
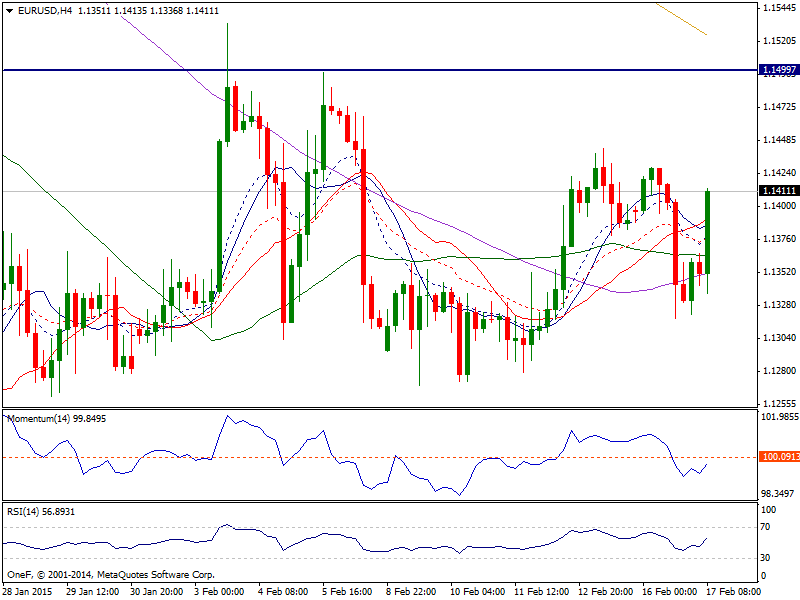
EUR/USD: Yesterday was all about the Eurogroup meeting and the euro traders reacted with a fair degree of caution. The daily trading range was not huge at just over 90 pips but the market looked to be ready to put a little bit more selling pressure on the euro. There has been no significant damage done yet to the consolidation with the support at $1.1260 still intact, but the prospects of a recovery of any note still look slim. Volume was light (the smallest volume since 25th August) with the US on public holiday too, so this may mean that when the US comes back online today there could be further selling pressure. However, for now the intraday hourly chart suggests the outlook is still reasonably neutral with support formed at $1.1317 still well above the key near/medium term low of $1.1260.
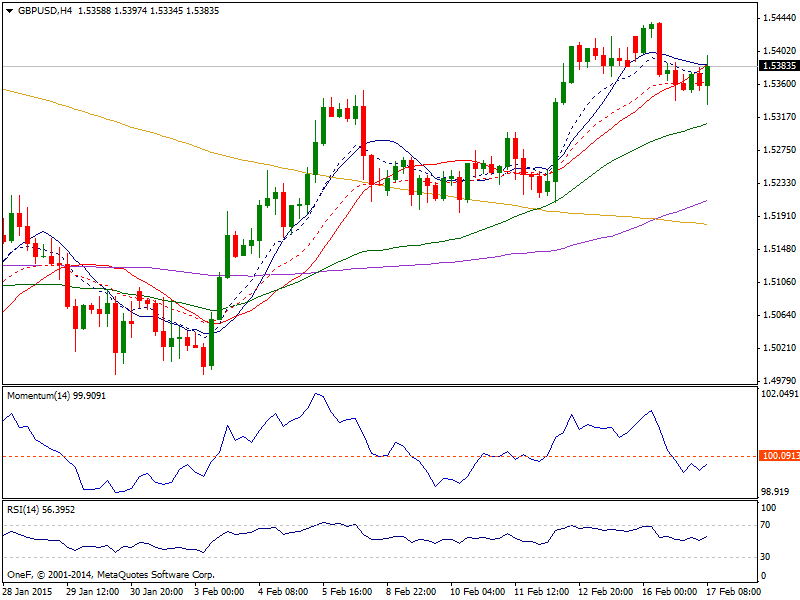
GBP/USD: After having made a session high yesterday at 1.5440, Cable has reversed to head quite sharply lower, currently sitting just above the lows of 1.5338, making a key day reversal in doing so and will now sit close by current levels, waiting on the upcoming CPI data (Headline exp +0.3% yy, Core exp +1.3%yy) . As BOE Governor Mark Carney said last week, the BOE are prepared for a near term drop in inflation but as long as the Core figure remains firm, Cable should not be sold off too hard. On the downside the nearby Fibo support at 1.5333 (23.6% of 1.4987/1.5440), where the 100 HMA also lies. Under this, would see a return towards 1.5300 (200 HMA 1.5290), below which would see us back in the 1.5200/1.53 consolidation that has dominated trade over the last few sessions (1.5265:38.2% of 1.4987/1.5440) but I don’t think we are heading back towards 1.51/1.500 quite yet. On the topside, which from the look of the short term indicators seems a little less likely today, minor trend resistance is to be seen at around 1.5370, a break of which may again test 1.5400 and eventually 1.5440, although I don’t really see it happening today unless the CPI comes in much higher than expected, raising hopes of an early rate hike.
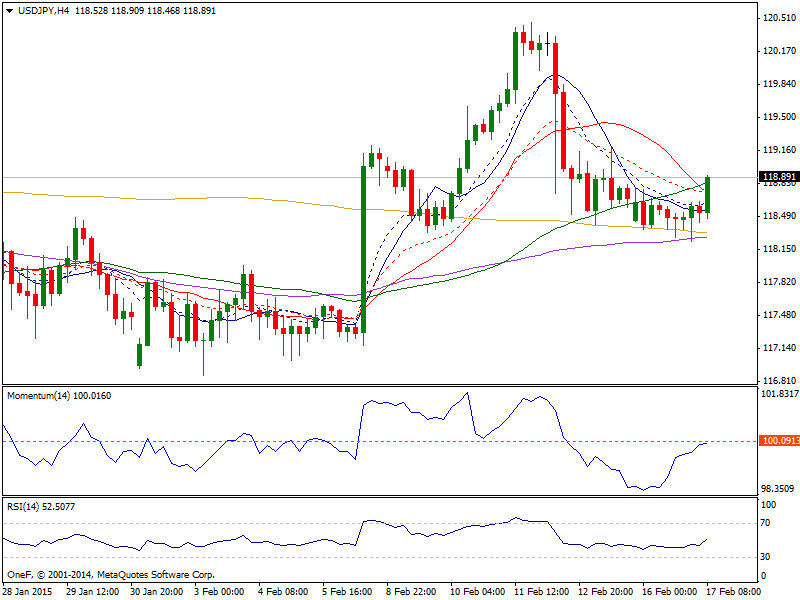
USD/YEN: The USD/YEN pair went back and forth during the course of the session on Monday, as the market finds support near the 118 handle. With that, the market should continue to go higher given enough time, but we do not have the right set up at the moment. We believe that there is much more support below as well, so it’s only a matter of time before we get the buying opportunity and therefore are not paying attention to sell signals. If we can break higher than the top of the range for Monday, we would be buyers just as we would be buyers of supportive candles.
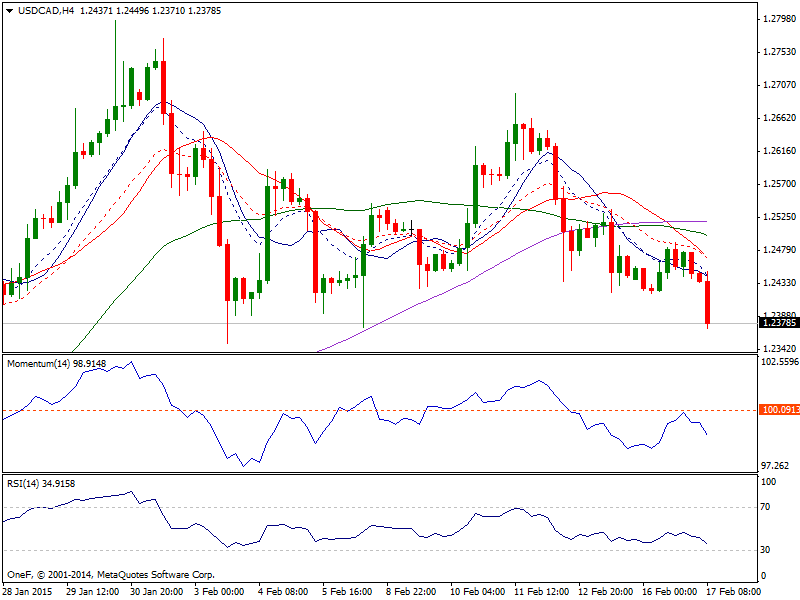
USD/CAD: The USD/CAD pair broke higher during the course of the session on Monday, testing the 1.25 handle. If we can break above that level, the market should continue to go higher, as the bullish trend should continue to push the US dollar higher overall. Pullbacks at this point time continue to offer value as the US dollar is the favored currency by Forex traders around the world. Even if we broke down from here, we believe that the floor in the market right now is somewhere near the 1.20 handle, and extends all the way down to the 1.18 level.
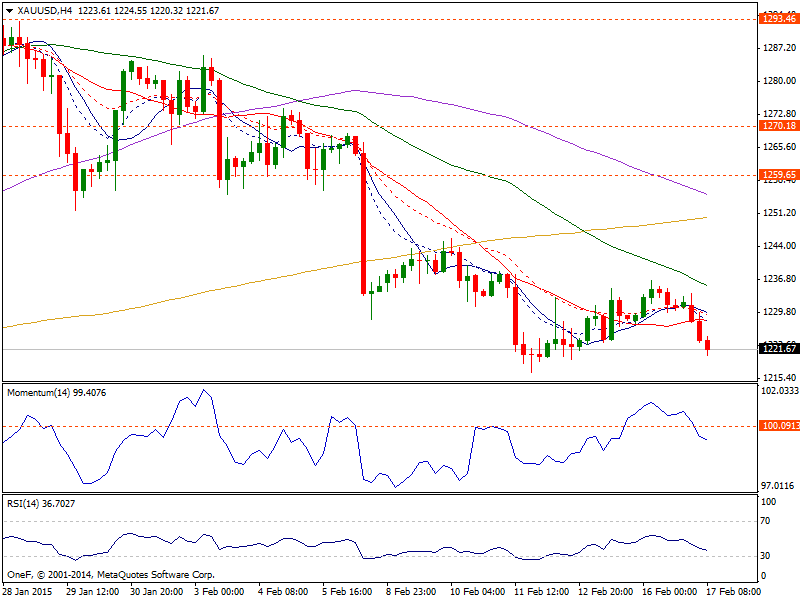
Gold: I remain mindful of the continuation of the four week downtrend and bearish correction that I believe is beginning to dominate this chart. The sequence of lower highs and lower lows continues and despite posting three days of gains I am worried that the bears may once more be ready to take control. The three consecutive up days have not been strong candles with two of the three days showing closing prices in the bottom half of the candle. The intraday hourly chart shows the rebound has taken gold back into a resistance band $1230/$1245 and may well now have posted a near term high at $1236.50. Hourly momentum indicators have rolled over and if the minor reaction low at $1222.70 is now breached then the outlook could be once more looking bearish. For now the bulls will be hanging on to their rebound argument, but the forces of the 4 week downtrend are still sizeable. I expect that having broken the support around $1222 last week the pressure will remain to the downside and there will be a retest of $1216.50. Key overhead resistance is at $1245 and $1251.90 with the downtrend currently falling at around $1247.
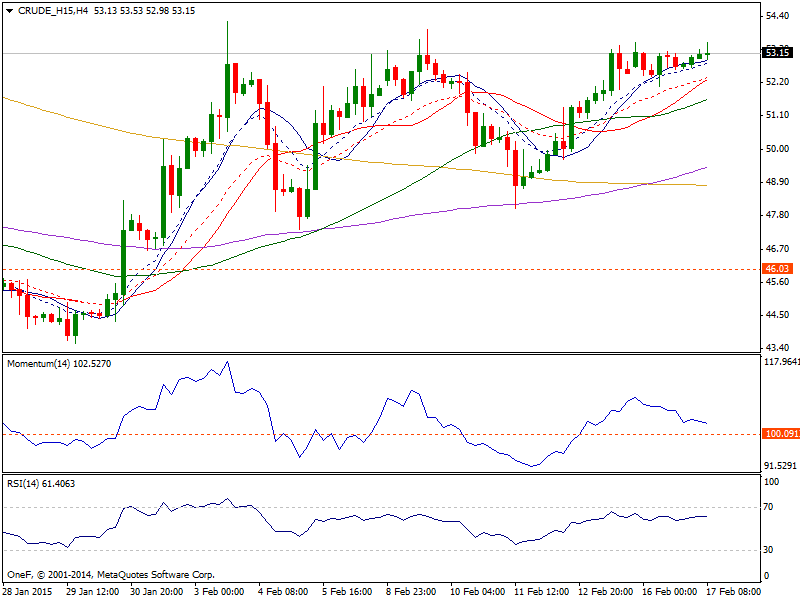
WTI Oil: Technically there is no change today after finishing unchanged from Friday. The 4 hour and daily indicators still look positive though and if we can overcome Friday’s high of 53.41, then above the triple top resistance that has now formed at around 53.50 we look to be headed higher towards last Monday’s 53.95 high, last Tuesday’s top at 54.21 and then towards 55.08 (2 Jan high). The downside will again see bids at minor rising trend support at around 51.50 and then at the 100/200 HMA at 51.05. Below here would hint at a revisit of 50.00 and then at Thursday’s session low at 49.12. I don’t really see it down here, but if wrong, then we could get another run towards 48.00 and the 5 Feb low at 47.35.