Daily Market Update – 17/03/15
March 17, 2015Tuesday 17th March 2015 – 09:00
The dollar fell across the board today on the back of some soft US data and on concerns that its recent rise has been too rapid which could prompt the Fed to be a little more cautious about raising interest rates this year and may prompt it to keep the word “patience ” in the language at Wednesday’s FOMC meeting.There is some economic data to focus on today though, with the Eurozone final CPI inflation reading at 1000GMT, which is expected to come in line with the flash reading of-0.3%. The German ZEW economic sentiment, also at 1000GMT and is expected to continue to improve again to 58.2 (from 52.7) which would continue the recent trend. Then into the afternoon there is the US housing data at 1230GMT with the Building Permits (1.07m expected) and the Housing Starts (1.05m expected).
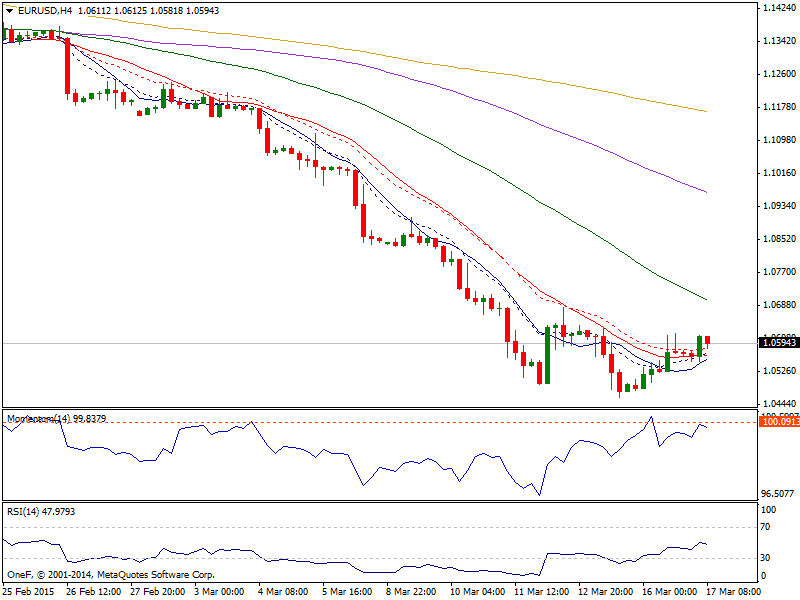
EUR/USD: The Euro managed to briefly pull back above 1.0600 yesterday, after failing to push below 1.0450, but it needs to get back above 1.0630 to suggest a larger pull back towards 1.0800. The risk remains for a significant short squeeze given we still remain rather overextended, as the market looks for the move towards parity.
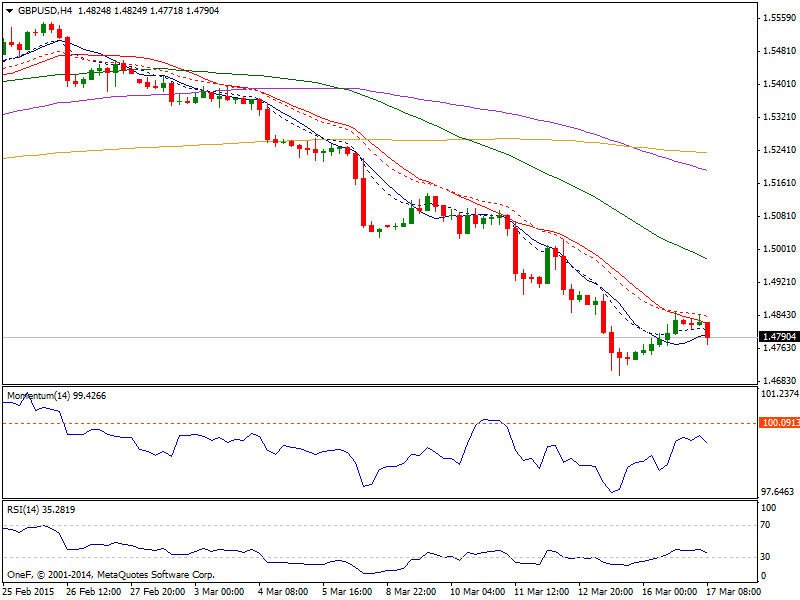
GBP/USD: The GBP/USD pair broke higher during the course of the session on Monday, slicing back above the 1.48 level. That being the case, the market looks as if we are testing the resistance barrier that extends all the way to the 1.50 level which will offer a selling opportunity sooner or later and we simply have to wait to find a resistant candle in order to start selling yet again. It is not until we break well above the 1.50 level that we would even consider buying. However, atthis point time we are simply waiting for our opportunity to sell. As with the euro though, the big caveat to the technical picture in the next couple of days is the FOMC meeting which could see traders sit on their hands for now.
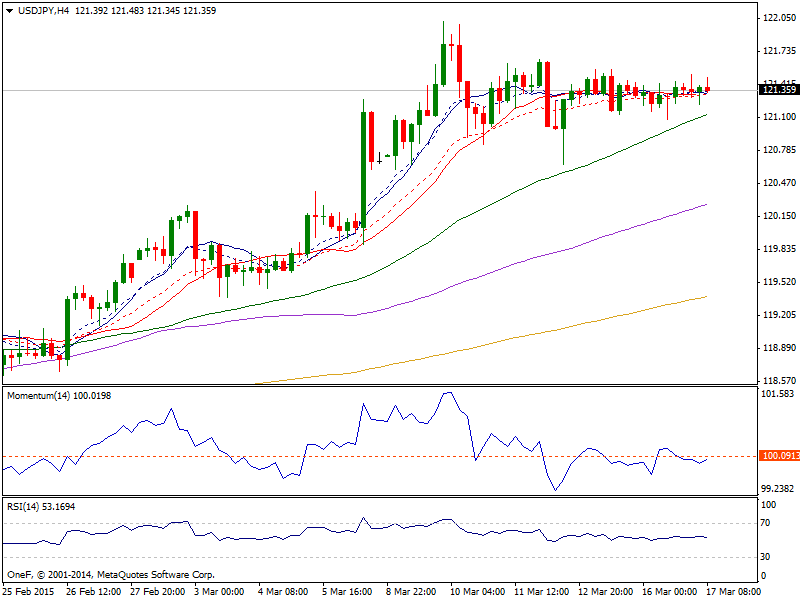
USD/YEN: The USD/YEN pair fell during the session initially on Monday, but found enough support underneath to turn things back around and form a hammer. With this, it looks like the USD/JPY pair will continue to go higher. The 1.22 level might be slightly resistive, but it’s only a matter of time before we break out above there. With that, we are of course bullish and have no interest whatsoever in selling this market as we think that there is more than enough support below to keep this market from falling for any significant amount of time.
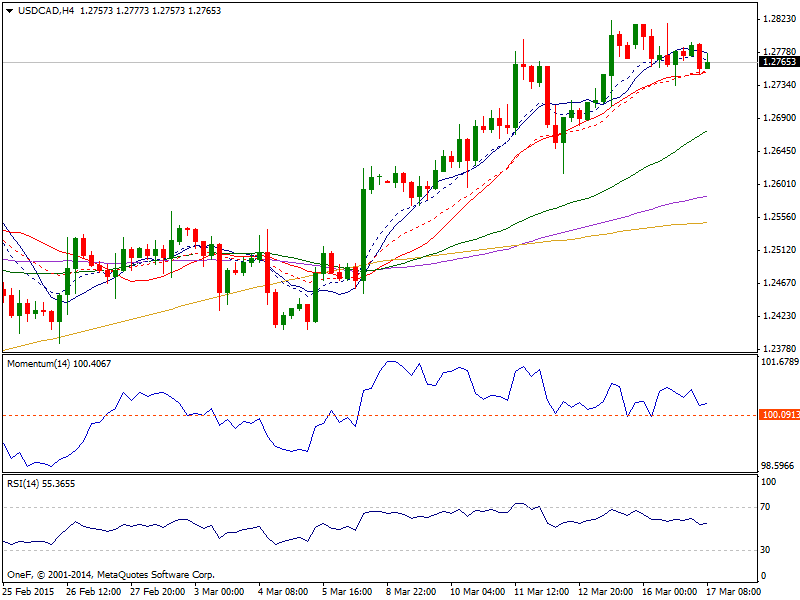
USD/CAD: The USD/CAD pair initially fell during the session on Monday, but found enough support near the 1.2750 level to turn things back around and form a hammer. This shows that we are without a doubt very well supported below and the recent break out to the upside should continue to push the market higher. However, we recognize that the 1.30 level above is massively resistive, so we may have to build up a little bit of momentum in order to reach that area. As far as breaking above there, it’s going to take quite a bit more momentum to do that, but ultimately we think it’s only a matter of time.
Gold: Gold’s had another range-bound session today (1150/65) as it continues to coil up and hinting that we are shortly in for a decent break-out one way or the other, possible after the Fed decision on Wednesday. In the meantime it is still managing to hold on above the 1 Dec low at 1142, but below which would head towards the 7 Nov low at 1131. Eventually I suspect we are in for a move towards 1100 and lower, towards important levels at 1085 (Mar 2010 low) and to 1044 (Jan 2010 low). The topside may still need to allow the short term charts unwind their oversold condition and 1165 will continue to provide resistance ahead of 1175 and 1185, although I don’t think we are likely to see it up here ahead of the Fed, although they may change that outlook on Wednesday if they do nothing. If the dollar uptrend continues, Gold will not remain at these levels and is eventually going to come under more severe downside pressure.

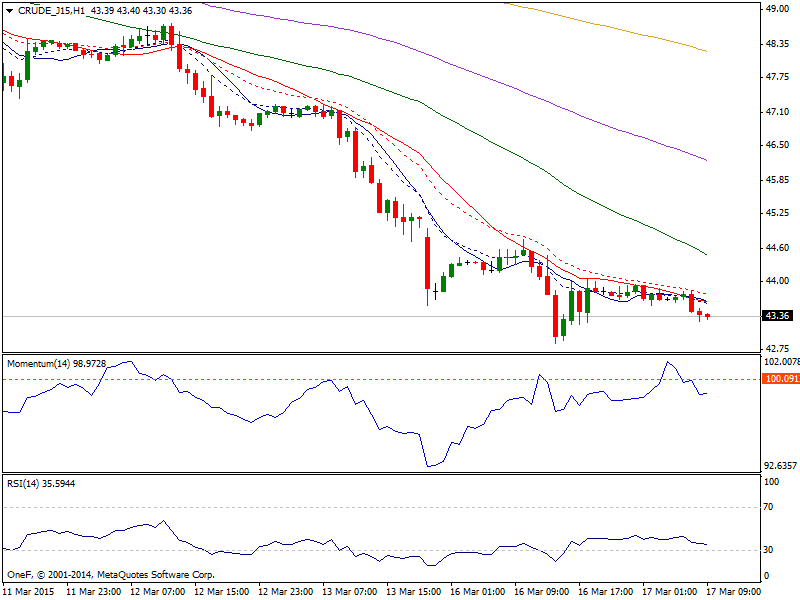
WTI Oil: The weakness of the WTI price in the past 8 days has been incredible, losing 16% in that time is a huge fall. The momentum is very negative but also has significant furtherdownside potential. Yesterday we also saw the oil price fall to a new 6 year low dating back to February 2010 on a move below $43.58. After an intraday rebound, we are now still looking for a close below the support to confirm the breakdown. The intraday hourly chart has taken to using the 21 hour moving average ($43.80) as a decent basis of resistance in the past few days. The hourly RSI is firmly in bearish configuration and showing that any rallies are seen as a chance to sell. The rally high from yesterday at $44.78 becomes the initial resistance, whilst during the original bear market run there was a pivot level that formed around $46 and could also be a barrier for a recovery.