


Daily Market Update – 20/02/15
February 20, 2015Friday 20th February 2015 – 09:30
It has been another generally choppy session with Greek headlines again being the main focus, especially after Germany rejected the Greek proposal to extend the current loan conditions. Germany is ruling the show and still needs to sign off on the proposal, but from all accounts the fact there is a special meeting to be held during the European afternoon (14:00 GMT) suggests that we should get something meaty for markets to sink their teeth into. Traders will be watching out for UK Retail Sales today at 0930GMT. Despite an expected slight month on month dip by 0.1% the year on year reading is expected to improve to +5.9%. Sterling tends to react to the retail sales data. Early in the European session there are the Eurozone flash PMIs, with the regional data at 0900GMT which is expected to show another slight improvement to 51.5 (from 51.0). The US flash PMI is this afternoon at 1445GMT and is expected to dip slightly to 53.6 from 53.9. The Eurogroup meeting starts at 1500GMT.
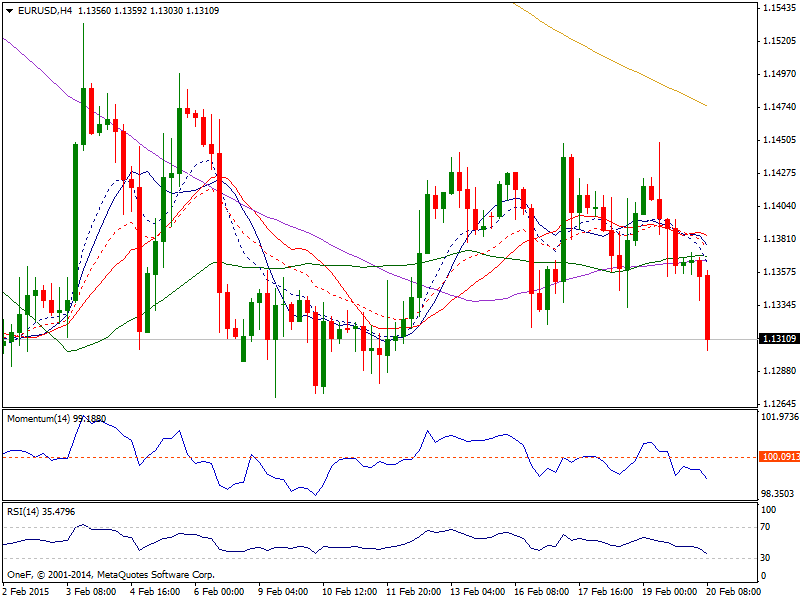
EUR/USD: The euro continues to trade in a very tight range and the range is getting tighter as time goes on without any definitive news out of the Eurogroup meeting with Greece. The daily chart shows the euro has been in the doldrums now for almost two weeks as the indecisive candles continue to mount. A range between $1.1260/$1.1530 just cannot be broken. The intraday hourly chart is a touch more interesting with this range actually being tightened to $1.1320/$1.1450, with the intraday RSI potentially being used as an indicator to play the extreme levels of the range, buying the hourly RSI towards 30 and selling around 70. The truth is though I see this range play continuing until there is a resolution over the Greek issue. This might come today, but with a 3rd meeting of the finance ministers. An agreement between the sides would boost the euro, whilst an acrimonious failure would put selling pressure on.
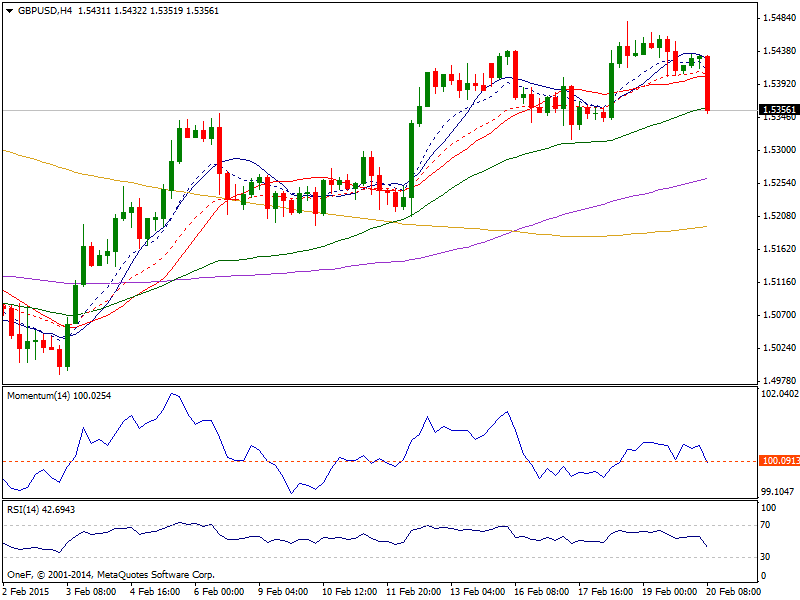
GBP/USD: The GBP/USD pair went back and forth during the course of the session on Thursday as we continue to try to get above the 1.55 handle. There are several things going on at the same time here, such as the large, round, psychologically significant number of 1.55 back in as resistance, and the 100 day EMA crossing at this point. It was also support at one point in the past, so it should now be resistance based upon basic technical analysis. As soon as we get a resistant candle, we are more than willing to sell this pair because we believe that the market is going to drop back down to the 1.53 level then. Even if we broke above, it is not until we clear the 1.58 level that we feel that the resistance is finally cleared.
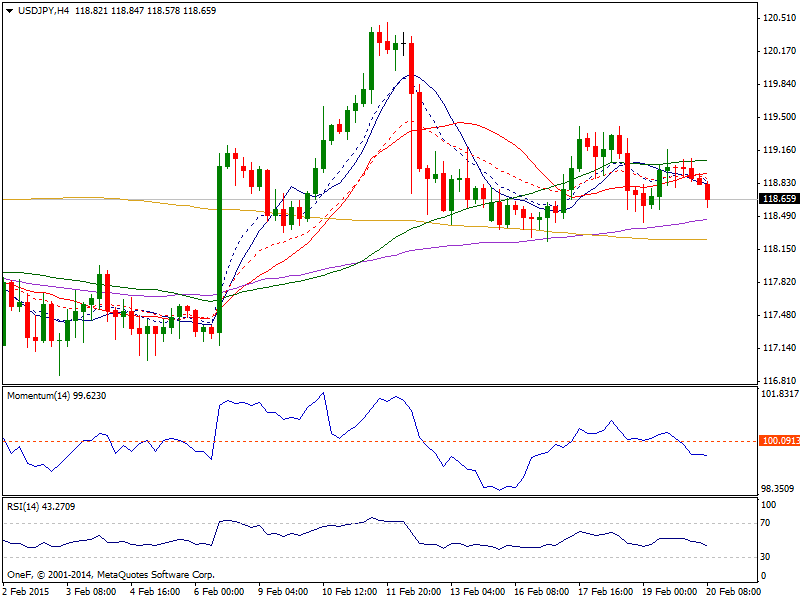
USD/YEN: The USD/YEN pairinitially rose during the session on Thursday, but found a little bit of resistance above the 119 handle. With that, we ended up forming a little bit of a shooting star, but quite frankly the market looks like it’s ready to grind away in this general vicinity. The 118 level below should be supportive, and quite frankly this is a one-way trade as far as we can see. The 120 level above is the target, and eventually the 122 level. We have no interest whatsoever in selling this marketplace.
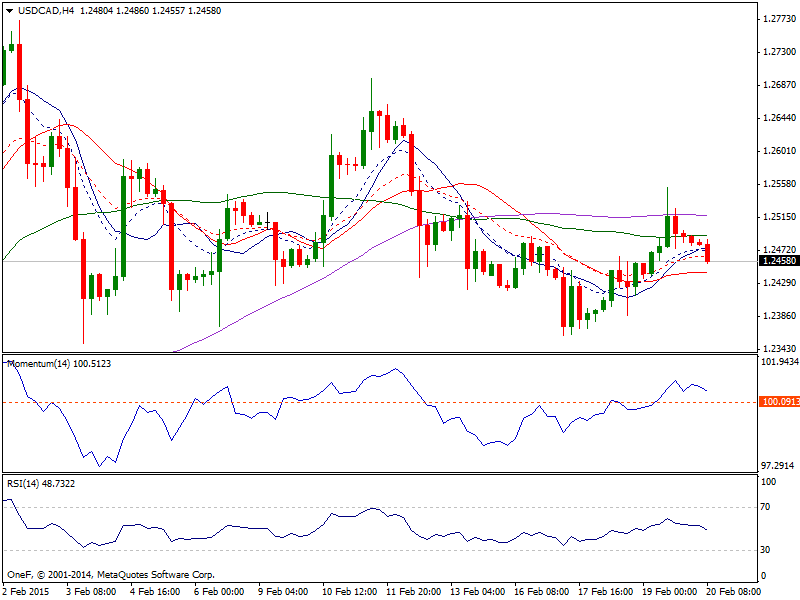
USD/CAD: The USD/CAD broke higher during the course of the session on Thursday, as the 1.25 level continues to be a bit of a magnet for price. That being the case, the market looks as if it’s ready to continue to go higher, if we can break above the top of the range for the session. Ultimately though, we only buy this pair, because the US dollar of course is the strongest currency in the Forex world right now. On top of that, the crude oil markets certainly are not helping the Canadian dollar at this point in time.
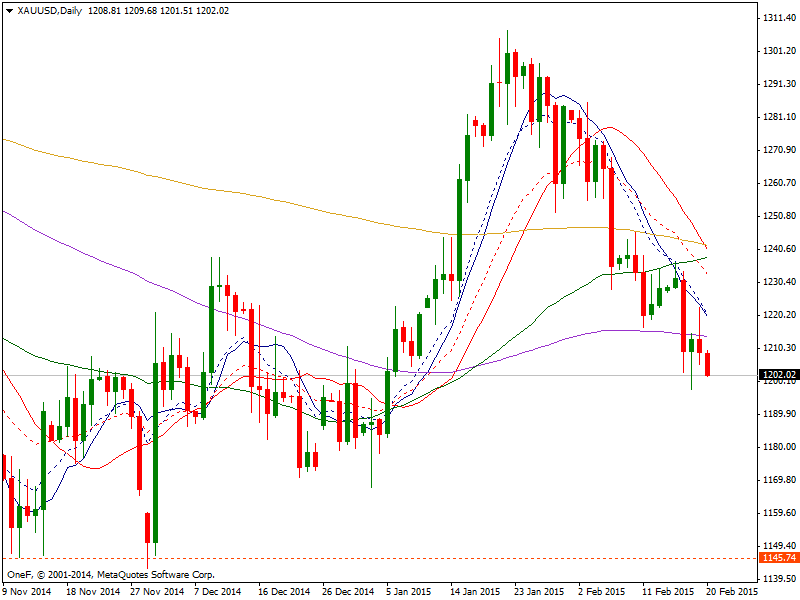
Gold: Most recently Gold pushed higher up to the resistance at 1222 before reversing to where it began, at 1207. We could be in for a repeat of this today, although given the bearish look of the dailies, I would be looking for a level to sell into the strength, hoping for an eventual break of the 1190/1200 support searching for a run towards 1185 and then possibly to Fibo support at around 1174 (76.4% of 1131/1307).
Silver: As with Gold, Silver headed up to the resistance at 16.80, where it conveniently topped out and headed back to 16.40. We could be in for the same again today, but given the bearish outlook of the dailies, any strength appears to be a sell opportunity, looking for a return to 16.20, beyond which would hint at a run towards 16.00 (15.97: 14.41/ 17.99) and possibly to the triple bottom at around 15.52.

WTI Oil: WTI had a volatile session, trading down to the 49.12 low seen last Thursday, before bouncing sharply to 52.11 and then settling back close to 51.00. More choppy trade looks to be instore and so I prefer to remain sidelined. 50.00 will again provide some support ahead of the 49.12 low. I don’t really see it down here again today, but if wrong, then we could get another run towards 48.00 and the 5 Feb low at 47.35. On the topside, above 52.10 would head towards 52.70 and possibly on to 53.00. Above this, the points to watch are at Wednesday’s 53.38 high, where the daily cloud base is proving a major hindrance and then at last Monday’s 53.95 high. Beyond that sits the double top that has formed at 54.15 and then 55.08 (2 Jan high).


