Indices Update – 27th January 2015
January 27, 2015Tuesday 27th January 2015 – 11.55
The election of the anti-austerity Syriza party in Greece has failed to dampen the spirits of investors still rising on the ECB’s QE wave. Sentiment does not appear to have been too significantly impacted either by the credit downgrade of Russia by ratings agency S&P which now places it as junk status. As for today the main focus away from Greece is back on the UK with the initial assessment of the UK economy’s economic performance for Q4. Also there are a number of data points in the US today, with strong numbers expected, but the impact of the data may be snowed out by the blizzard conditions hitting NYC at the moment.
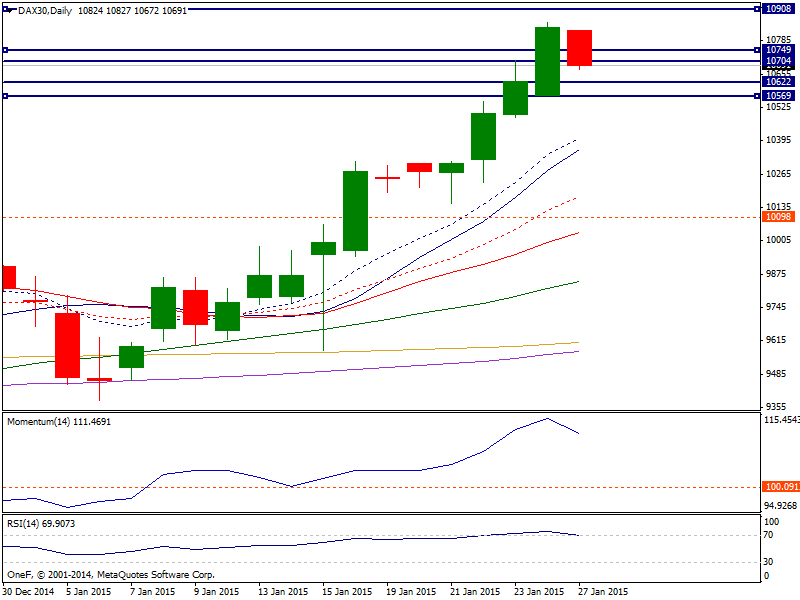
Dax: The Dax broke higher during the course of the day on Monday, clearing the 10700 resistance level and closing the day at fresh all time highs of 10798.33. German business confidence rose for a third month as falling oil prices and anticipation of more ECB stimulus boosted optimism about an economic recovery, reaching an intraday high of 10854.50. Technically the daily chart shows momentum heading strongly higher despite in extreme overbought territory, whilst RSI also heads north despite in 76. We believe that the DAX will head to the 12000 level at the very least, if not higher than that given enough time. We recognize that you need to look for value, which of course means pullbacks so that’s exactly what we are waiting on in order to start going long of the DAX yet again. We have no plans whatsoever on selling.
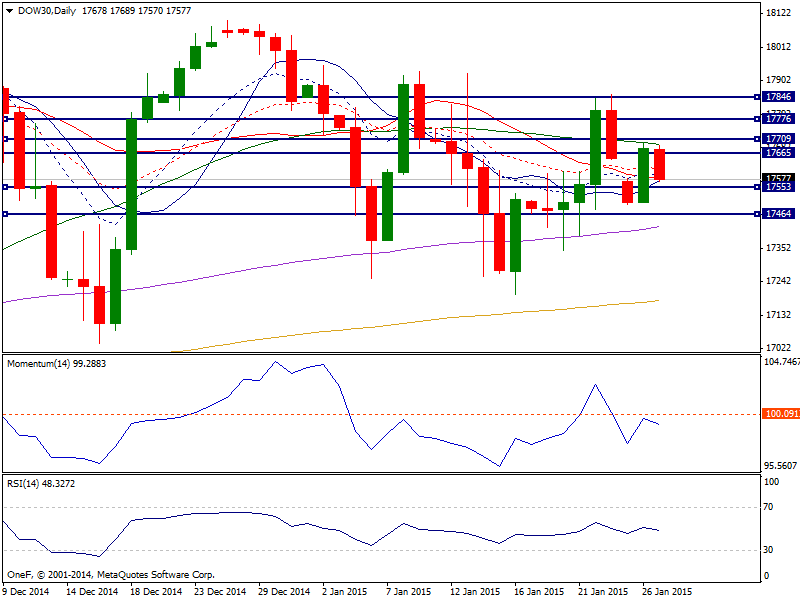
Dow: The Dow initially fell during the course of the session on Monday, but found enough support near the 17600 level to turn things back around and form a hammer. The Federal Reserve will start its first two-day policy meeting of the year today and will likely offer some tips on both US economy health and the probability of a rake hike mid-2015. Technically, the daily chart shows little upward potential as the index moved back and forth around a mild bearish 20 SMA for most of the last two sessions, whilst indicators hold in neutral territory. If we can break above the 17700 level, this market could go much higher. We think that ultimately this is a bullish market and we have no interest whatsoever in selling. Given enough time we do expect this market to break out above the 18100 level and then head to the 20000 level. Ultimately, buying on dips will be the way to go.
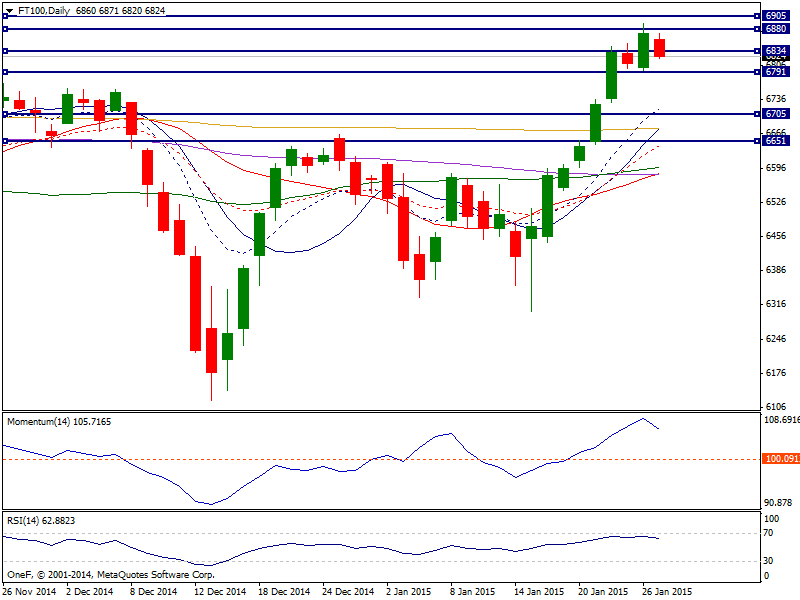
FTSE: The FTSE initially fell during the course of the session on Monday, but found enough support at the 6800 level to turn things back around and form a hammer closing at 6871, supported by a mild recovery in the energy sector. Technically, the index maintains a strongly bullish tone on the dailies as momentum heads higher in overbought levels and the index extends further above moving averages, although a strong static resistance level stands at 6880 where the index stalled several times during last 2014. That bounce of course suggests that there are buyers below and that the FTSE should continue to go much higher. We believe that the FTSE is heading to the 7000 level and look at pullbacks as value. We are very comfortable being very long of the FTSE going forward as we have seen such bullish pressure underneath. Selling isn’t even a thought.