Indices Update – 3rd February 2015
February 3, 2015Tuesday 3rd February 2015 – 09:45
The big ranges on stock markets that we saw throughout January continued yesterday on the first trading day of February as recovering oil prices and the possibility of a more moderate line on debt from the Greek government has allowed markets to bounce back this morning, appear to have raised hopes that we may well have seen a short term base after the declines of the last seven months. In the past couple of trading days the oil price has shot higher as it has looked as though there is finally beginning to be some reaction by suppliers in the US to the huge price falls. This has resulted in a spike higher in the oil price which has buoyed sentiment on equity markets again.
The big news overnight has been that the Reserve Bank of Australia is the latest to join the list of central banks to ease monetary policy, with a 25 basis point rate cut. This has resulted in selling pressure on the commodity currencies (Aussie, Kiwi and Loonie). During the day, traders will be watching out for UK construction PMI at 0930 GMT which is expected to dip slightly to 56.9 (from 57.6) and other than that it is just US Factory Orders at 1500GMT (-2.2% month-on-month expected), which is a notoriously spikey number. There will also be New Zealand unemployment tonight at 2145 GMT which is expected to dip slightly to 5.3%.
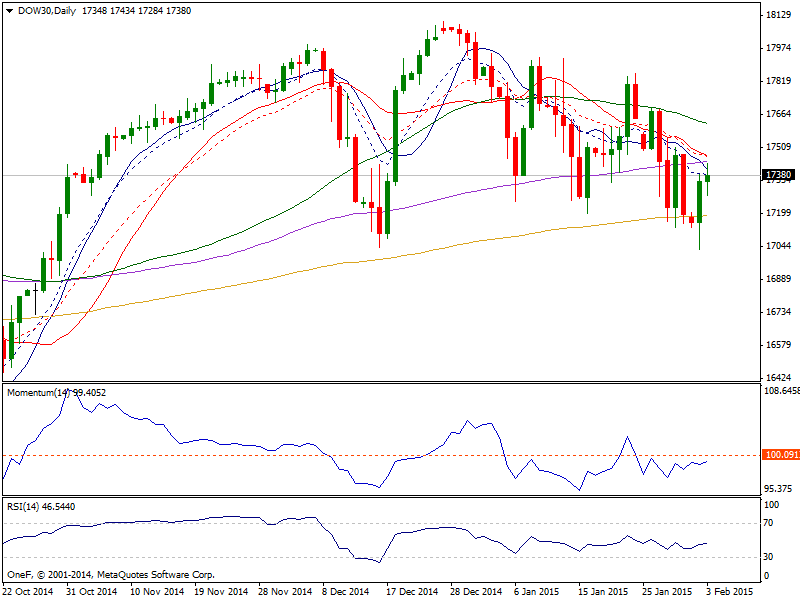
Dow: Having traded in the red for most of the American session, US index soared in the last hour with the Dow adding 195 points of 1.14% to close at 17360.78. Having struggled with mixed US data earlier on the day, the index surged late session as energy stocks advanced following oil prices’ recovery. The test of the 200-DMA will have been the event that some will have been waiting for. The resulting bounce has allowed the relative strength index and other momentum indicators to show a turnaround, with the former heading back towards the 50 mid-point. The daily chart shows that after extending below its 200 DMA, the index ended up sharply higher, erasing half of its Friday gains. Nevertheless, indicators hold below their midlines, as 20 SMA caps the upside around 17487, level to break to confirm further gains.
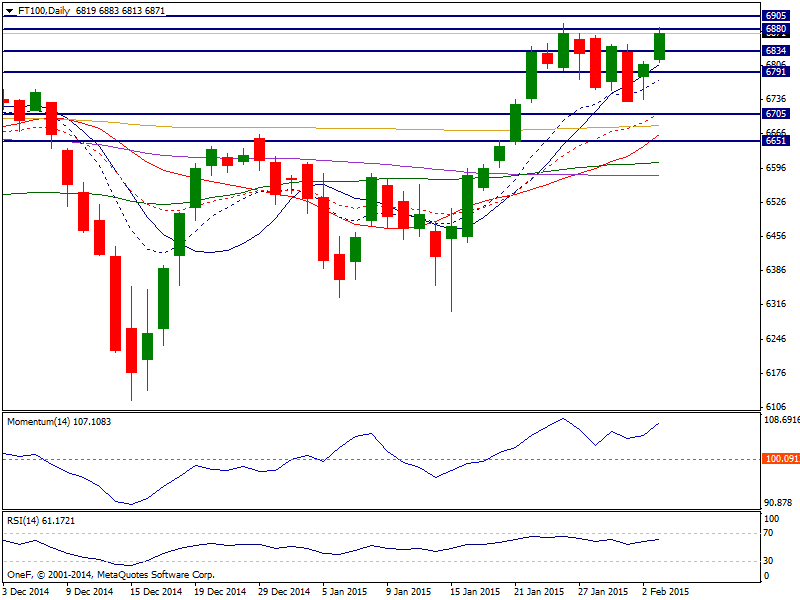
FTSE: The FTSE advanced on Monday up 0.49% to close at 6782.55, supported by rising oil prices that boosted the energy sector. Also better than expected UK PMI pointed out industrial activity rose in January. Oil’s apparent resurrection and renewed risk appetite in mining stocks has lifted the index back above 6800 this morning. With the high from Friday under threat we look towards resistance around the January high of 6890. Yesterday’s price action establishes 6720 as immediate support, followed by the 200-day moving average at 6675.
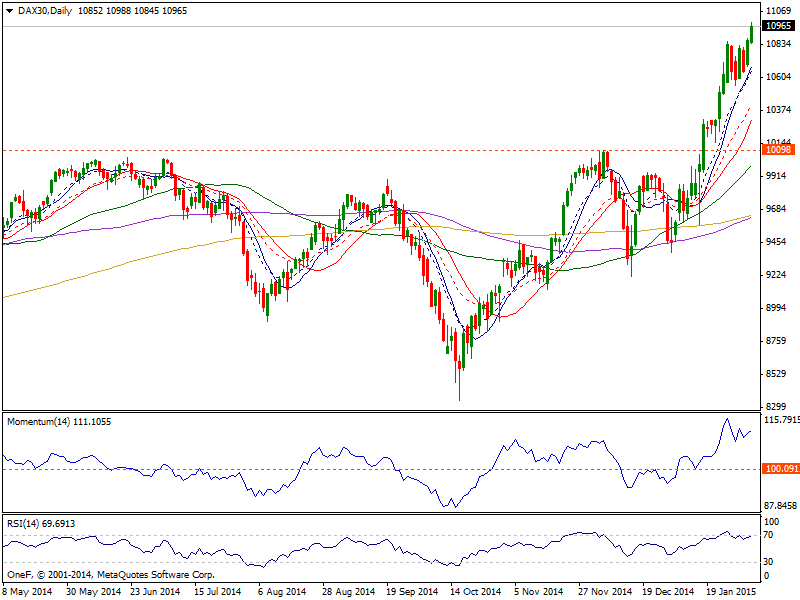
Dax: The Dax added another 1.25% this Monday, closing at 10828.01, despite local manufacturing data missing expectations. Nevertheless the index advanced to fresh all time highs after hours, boosted by news the ECB may start its bond buying program early March. The daily chart shows the index is breaking its latest range to the upside, while indicators maintain their bullish slope above their midlines. In the 4 hours chart the index finally accelerated above its 20 SMA, whilst RSI gains upward strength and momentum stands flat above 100. Investors will likely continue to push it higher, eyeing now the 11000 level for the upcoming sessions.